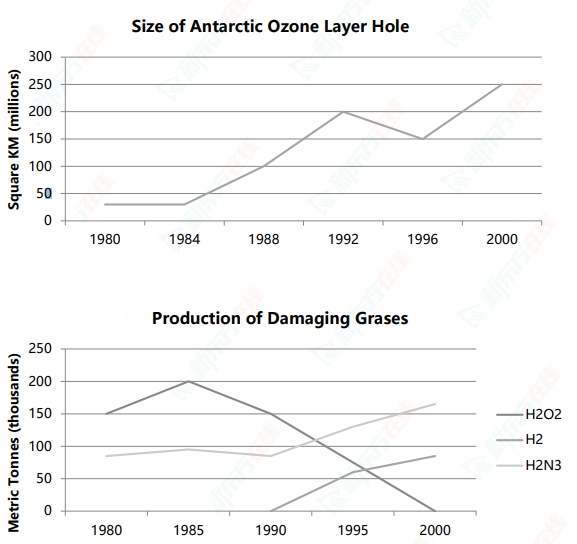
雅思曲线图小作文:1980-2000年南极臭氧层空洞的大小
2024.07.25 13:55
本文为大家带来的是雅思曲线图小作文:1980-2000年南极臭氧层空洞的大小以及三种破坏南极臭氧层的气体产生量,希望对大家的备考有所帮助。
1980-2000年南极臭氧层空洞的大小以及三种破坏南极臭氧层的气体产生量
The graph shows the size of the Ozone layer hole in the Antarctic and three productions of damaged gases to the Antarctic Ozone from 1980 to 2000.
Summarise the information by selecting and reporting the main features, and make comparisons where relevant.
1980 年至 2000 年南极臭氧层空洞的大小以及三种破坏南极臭氧层的气体产生量

【思路解析】
本篇小作文是动态曲线图。第一幅图主要描述在不同时间段的变化幅度,第二幅侧重趋势+对比。此外,由时间点可以看出两幅图的时态都应是过去时。最后一段可取极值概述或将两幅图片之间的关系做总结。
【雅思免费试听课-0元领取】
【雅思水平测试-免费】
【雅思备考资料-扫码添加助教免费领取】

课程推荐

扫码添加助教号
免费获取最新雅思口语题库

