题目
范文
2025/01/18Task 1混合图
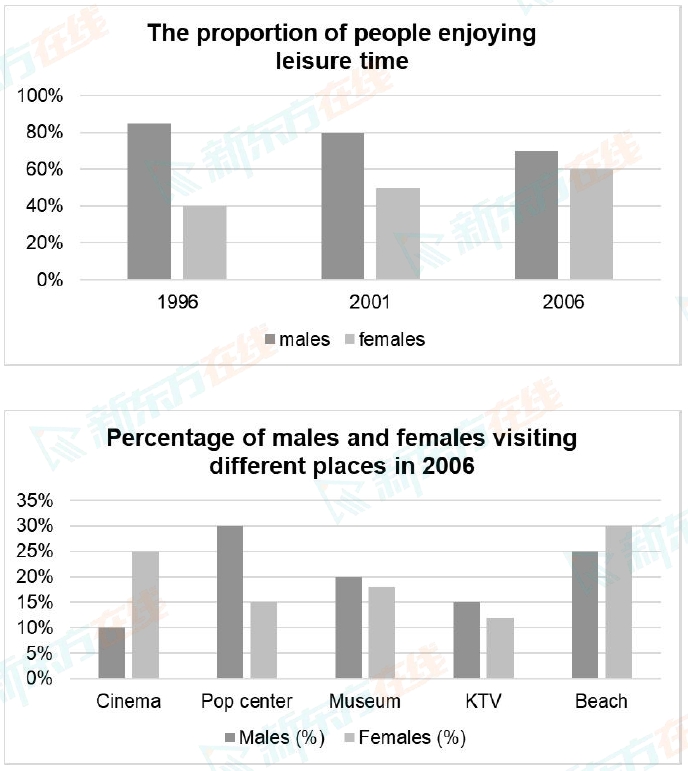
The bar charts below show the percentage of males and females who enjoyed leisure time from 1996 to 2006, as well as the percentage of males and females visiting different places in 2006.
Summarise the information by selecting and reporting the main features, and make comparisons where relevant.
Write at least 150 words.
Summarise the information by selecting and reporting the main features, and make comparisons where relevant.
Write at least 150 words.
高分范文
上一题
2025/02/08 Task 2下一题
2025/01/18 Task 2