题目
范文
2024/08/31Task 1饼状图
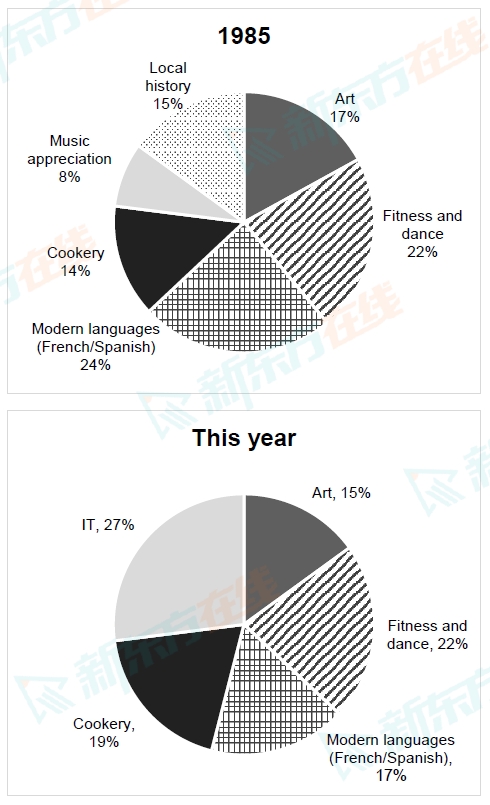
The pie charts below show the percentage of students at one adult education center taking various courses offered in 1985 and this year.
Summarise the information by selecting and reporting the main features, and make comparisons where relevant.
Write at least 150 words.
Summarise the information by selecting and reporting the main features, and make comparisons where relevant.
Write at least 150 words.
高分范文
上一题
2024/09/07 Task 2下一题
2024/08/31 Task 2