题目
范文
2024/06/01Task 1饼状图
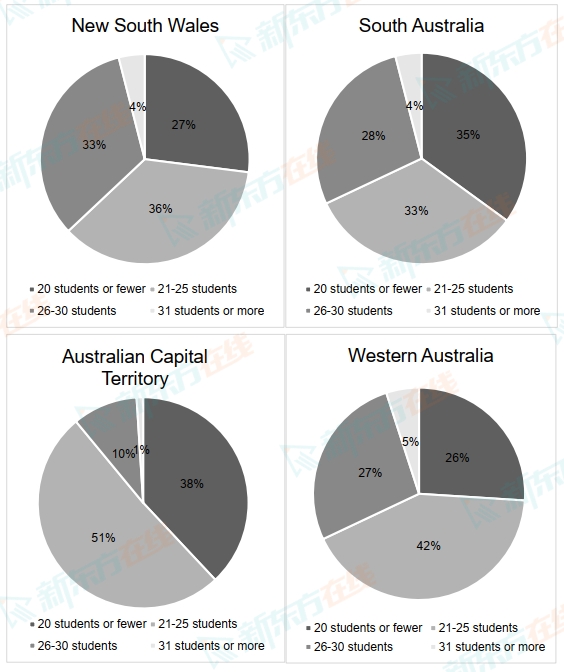
The pie charts show the class size in primary schools in four states in Australia in 2010.
Summarise the information by selecting and reporting the main features and make comparisons where relevant.
Write at least 150 words.
Summarise the information by selecting and reporting the main features and make comparisons where relevant.
Write at least 150 words.
高分范文
上一题
2024/06/08 Task 2下一题
2024/06/01 Task 2