题目
范文
2023/11/25Task 1混合图
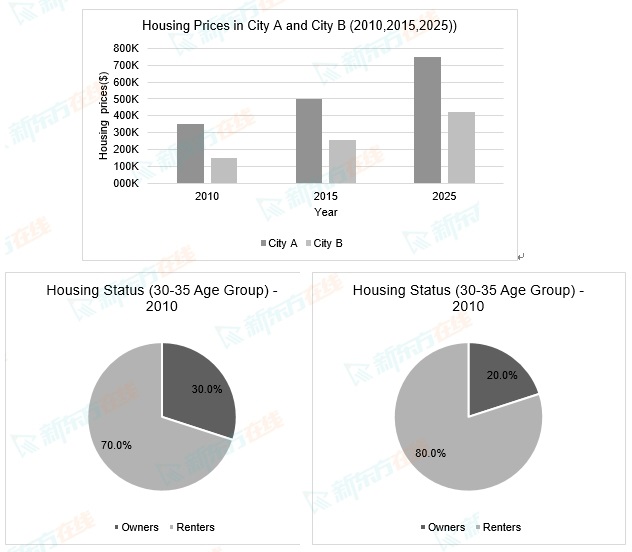
The first chart shows the average housing prices in two cities in one country in 2010 and 2015, with projections for 2025. The second chart shows the percentage of people aged 30-35 who owned a home in 2010 and 2015.
Summarise the information by selecting and reporting the main features, and make comparisons where relevant.
Write at least 150 words.
Summarise the information by selecting and reporting the main features, and make comparisons where relevant.
Write at least 150 words.
高分范文
上一题
2023/12/02 Task 2下一题
2023/11/25 Task 2