题目
范文
2023/09/09Task 1柱状图
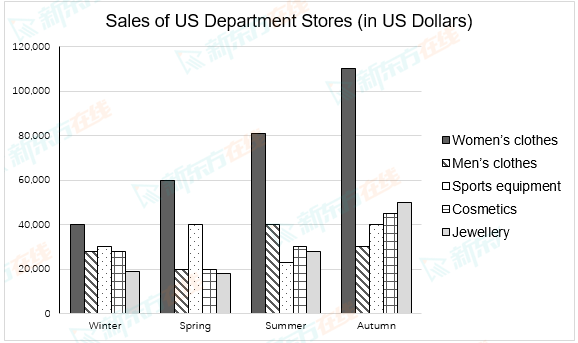
The graph below shows the sales of five types of items in four different seasons at a departmental store in the US in 2011.
Summarize the information by selecting and reporting the main features, and make comparisons where relevant.
Write at least 150 words.
Summarize the information by selecting and reporting the main features, and make comparisons where relevant.
Write at least 150 words.
高分范文
上一题
2023/09/23 Task 2下一题
2023/09/09 Task 2