题目
范文
2023/08/05Task 1表格
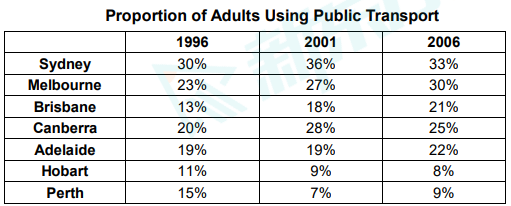
The table illustrates the changes in the proportion of adults who commute to work or study by using public transport in seven Australian cities between 1996 and 2006.
Summarise the information by selecting and reporting the main features and make comparisons where relevant.
Write at least 150 words.
Summarise the information by selecting and reporting the main features and make comparisons where relevant.
Write at least 150 words.
高分范文
上一题
2023/08/12 Task 2下一题
2023/08/05 Task 2