题目
范文
2023/07/29Task 1柱状图
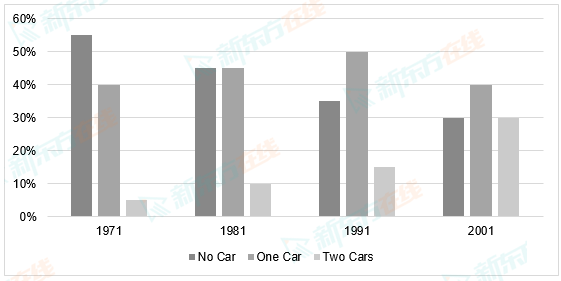
The bar chart shows the percentage of households with cars in a European country between 1971 and 2001.
Summarise the information by selecting and reporting the main features, and make comparisons where relevant.
Write at least 150 words.
Summarise the information by selecting and reporting the main features, and make comparisons where relevant.
Write at least 150 words.
高分范文
上一题
2023/08/05 Task 2下一题
2023/07/29 Task 2