题目
范文
2023/04/22Task 1混合图
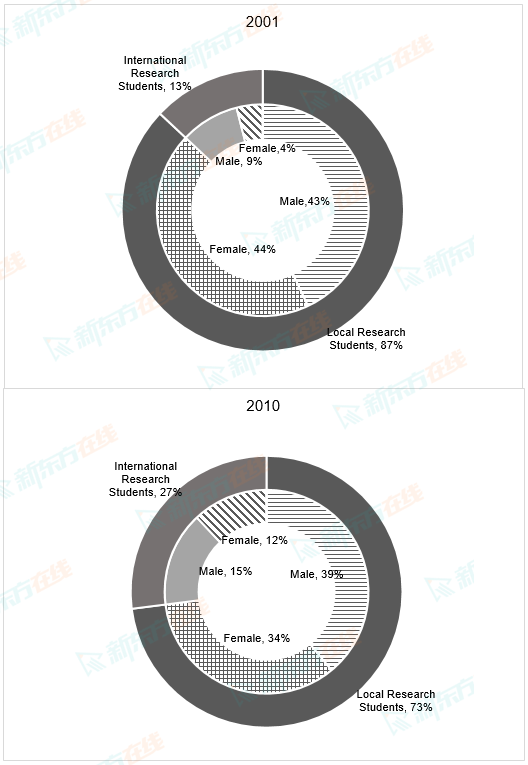
The table and pie charts show the number of research students in Australian universities in 2001 and 2010.
Summarise the information by selecting and reporting the main features, and make comparisons where relevant.
Write at least 150 words.

Summarise the information by selecting and reporting the main features, and make comparisons where relevant.
Write at least 150 words.
高分范文
上一题
2023/04/29 Task 2下一题
2023/04/22 Task 2