题目
范文
2022/08/20Task 1表格
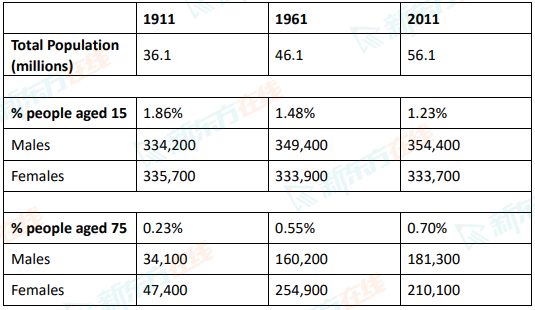
The table below shows the total population and the proportion of males and females aged 15 and aged 75 in the UK from 1911 to 2011.
Summarise the information by selecting and reporting the main features, and make comparisons where relevant.
Write at least 150 words.
Summarise the information by selecting and reporting the main features, and make comparisons where relevant.
Write at least 150 words.
高分范文
上一题
2022/08/27 Task 2下一题
2022/08/20 Task 2