题目
范文
2022/07/09Task 1柱状图
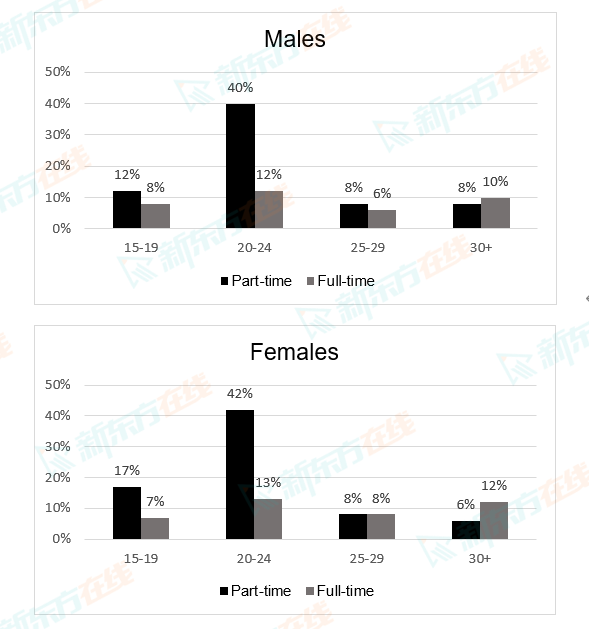
The charts below show the percentage of male and female students of different age groups who studied in Australia for full-time and part-time education in 2006.
Summarise the information by selecting and reporting the main features, and make comparisons where relevant.
Write at least 150 words.
Summarise the information by selecting and reporting the main features, and make comparisons where relevant.
Write at least 150 words.
高分范文
上一题
2022/07/16 Task 2下一题
2022/07/09 Task 2