题目
范文
2022/04/23Task 1柱状图
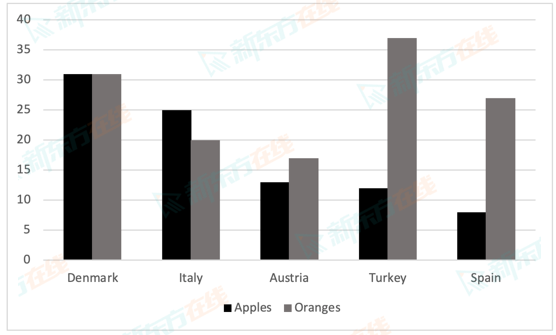
The chart below shows the consumption of apples and oranges per person in kilograms in five countries in 2013.
Summarise the information by selecting and reporting the main features, and make comparisons where relevant.
Write at least 150 words.
Summarise the information by selecting and reporting the main features, and make comparisons where relevant.
Write at least 150 words.
高分范文
上一题
2022/04/30 Task 2下一题
2022/04/23 Task 2