题目
范文
2022/04/09Task 1混合图
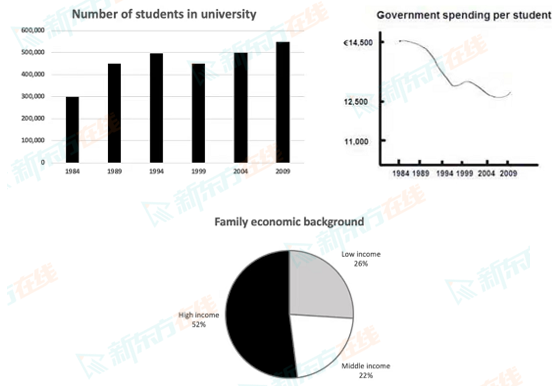
The charts and graph give information about the number of students at university in a European country from 1984 to 2009, government spending on these students in the same period, and family economic background in 2009.
Summarise the information by selecting and reporting the main features, and make comparisons where relevant.
Write at least 150 words.
Summarise the information by selecting and reporting the main features, and make comparisons where relevant.
Write at least 150 words.
高分范文
上一题
2022/04/16 Task 2下一题
2022/04/09 Task 2