题目
范文
2021/12/11Task 1曲线图
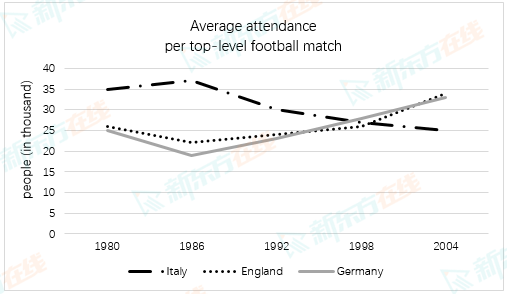
The graph below shows the average number of people attending top-level football matches in three European countries from 1980 to 2004.
Summarise the information by selecting and reporting the main features, and make comparisons where relevant.
Write at least 150 words.
Summarise the information by selecting and reporting the main features, and make comparisons where relevant.
Write at least 150 words.
高分范文
上一题
2021/12/18 Task 2下一题
2021/12/11 Task 2