
题目
范文
2021/11/2720211127_t1柱状图
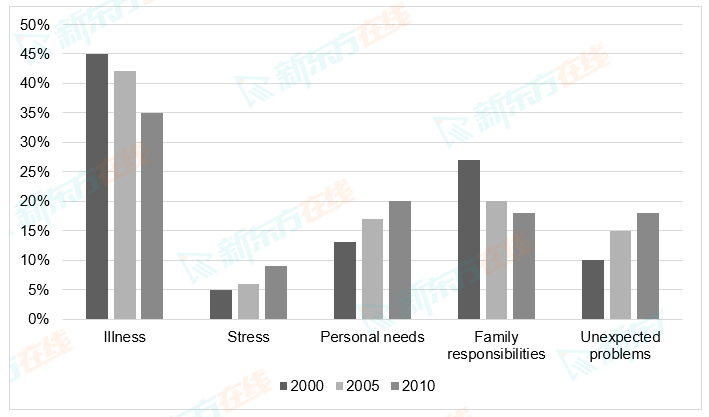
The chart below shows the percentages of staff not going to work for different reasons between 2000 and 2010.
Summarize the information by selecting and reporting the main features, and make comparisons where relevant.
Write at least 150 words.
Summarize the information by selecting and reporting the main features, and make comparisons where relevant.
Write at least 150 words.
高分范文
上一题
2021/12/02 Task 2下一题
2021/11/27 Task 2