题目
范文
2021/09/04Task 1柱状图
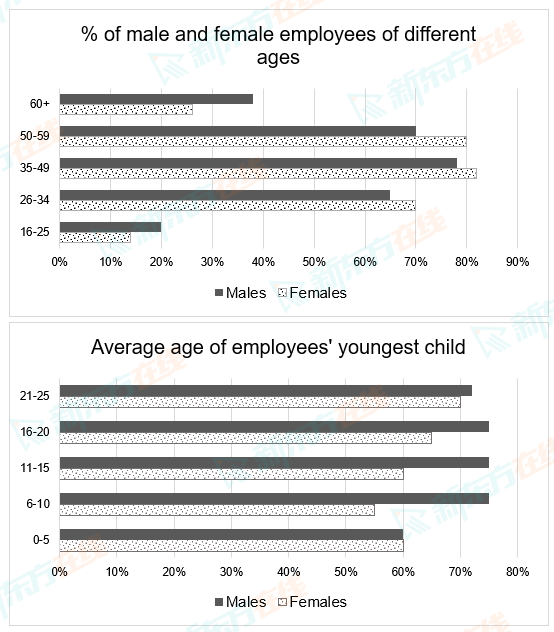
The charts below show employment rates of males and females of different ages and the average age of their youngest child in the UK in 2008.
Summarise the information by selecting and reporting the main features, and make comparisons where relevant.
Write at least 150 words.
Summarise the information by selecting and reporting the main features, and make comparisons where relevant.
Write at least 150 words.
高分范文
上一题
2021/09/11 Task 2下一题
2021/09/04 Task 2