题目
范文
2021/05/15Task 1曲线图
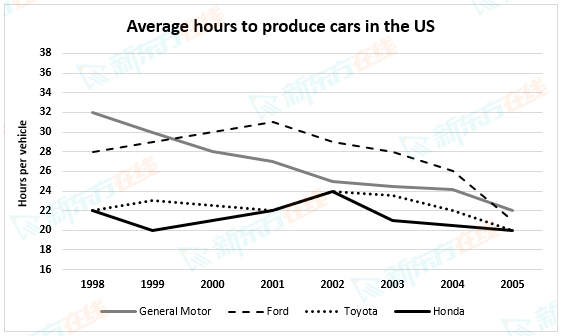
The graph below shows the average time spent by four car manufacturers to produce vehicles at their US factories from 1998 to 2005.
Summarise the information by selecting and reporting the main features, and make comparisons where relevant.
Write at least 150 words.
Summarise the information by selecting and reporting the main features, and make comparisons where relevant.
Write at least 150 words.
高分范文
上一题
2021/05/20 Task 2下一题
2021/05/15 Task 2