题目
范文
2019/07/27Task 1柱状图
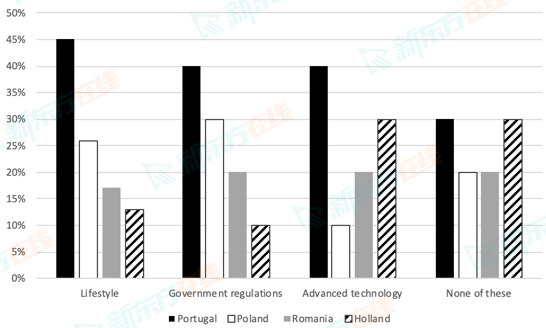
The chart below shows the percentages of young people choosing different ways to solve the global warming in four different countries in 2008.
Summarise the information by selecting and reporting the main features, and make comparisons where relevant.
Write at least 150 words.
Summarise the information by selecting and reporting the main features, and make comparisons where relevant.
Write at least 150 words.
高分范文
上一题
2019/08/01 Task 2下一题
2019/07/27 Task 2