题目
范文
2019/07/20Task 1柱状图
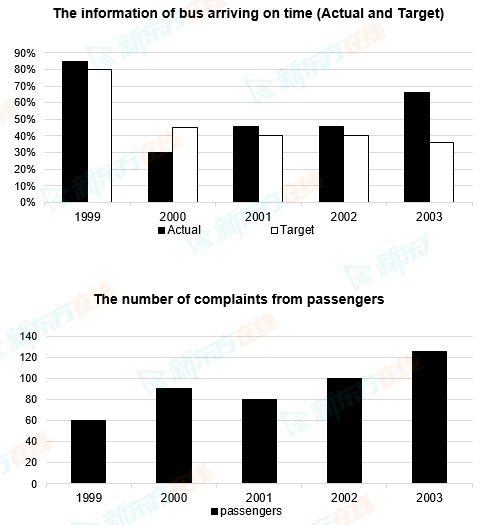
The chart below shows the information about the arriving time of bus and the number of complaints from passengers in a US bus company from 1999 to 2003.
Summarise the information by selecting and reporting the main features, and make comparisons where relevant.
Write at least 150 words.
Summarise the information by selecting and reporting the main features, and make comparisons where relevant.
Write at least 150 words.
高分范文
上一题
2019/07/27 Task 2下一题
2019/07/20 Task 2