题目
范文
2019/06/22Task 1柱状图
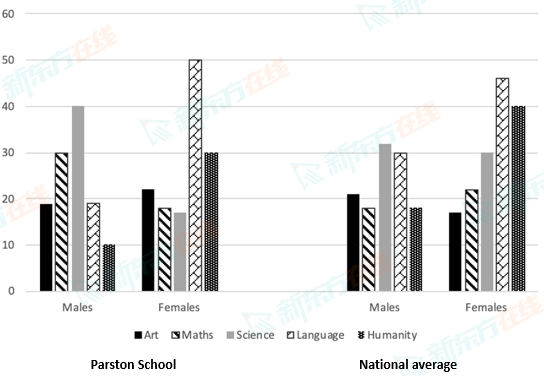
The chart below shows the percentage of males and females with top grades in the Parston School, compared with the national average grades.
Summarise the information by selecting and reporting the main features, and make comparisons where relevant.
Write at least 150 words.
Summarise the information by selecting and reporting the main features, and make comparisons where relevant.
Write at least 150 words.
高分范文
上一题
2019/06/29 Task 2下一题
2019/06/22 Task 2