题目
范文
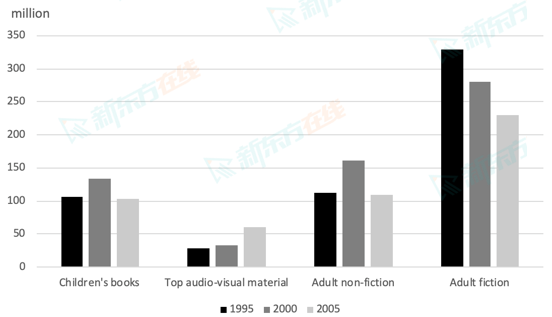
2019/03/09Task 1柱状图
The chart below gives the information about library borrowing in UK public libraries from 1995 to 2005.
Summarise the information by selecting and reporting the main features, and make comparisons where relevant.
Write at least 150 words.
Summarise the information by selecting and reporting the main features, and make comparisons where relevant.
Write at least 150 words.
高分范文
上一题
2019/03/14 Task 2下一题
2019/03/09 Task 2