题目
范文
2019/01/17Task 1柱状图
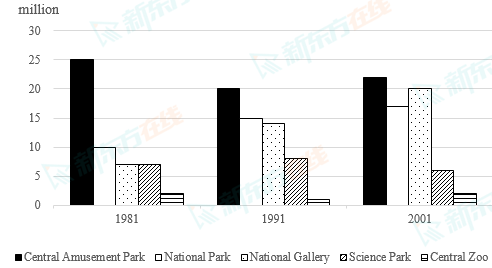
The chart below shows the number of visitors to tourist attractions in a European city in 1981, 1991 and 2001.
Summarise the information by selecting and reporting the main features, and make comparisons where relevant.
Write at least 150 words.
Summarise the information by selecting and reporting the main features, and make comparisons where relevant.
Write at least 150 words.
高分范文
上一题
2019/01/19 Task 2下一题
2019/01/17 Task 2