题目
范文
C15-T2-T1曲线图
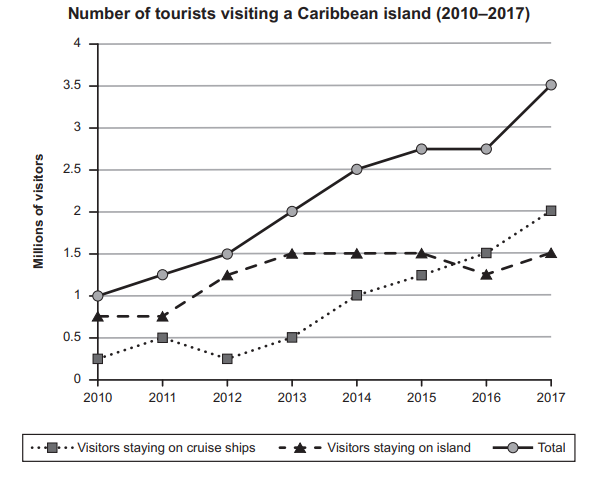
The graph below shows the number of tourists visiting a particular Caribbean island between 2010 and 2017.
Summarise the information by selecting and reporting the main features, and make comparisons where relevant.
Write at least 150 words.
Summarise the information by selecting and reporting the main features, and make comparisons where relevant.
Write at least 150 words.
高分范文