题目
范文
2020/10/17Task 1混合图
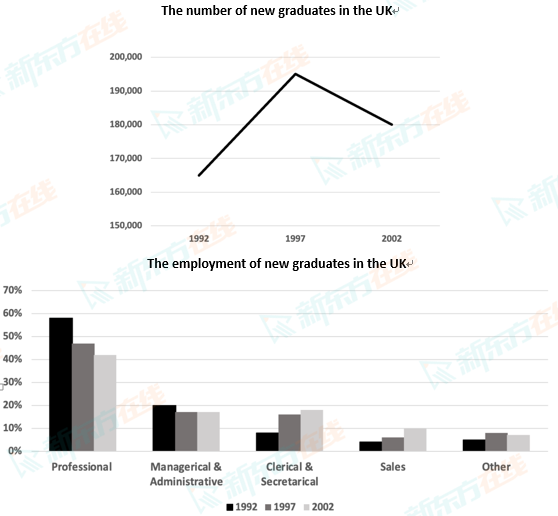
The graph and chart below give information about the number of new graduates and their employment in the UK from 1992 to 2002.
Summarise the information by selecting and reporting the main features, and make comparisons where relevant.
Write at least 150 words.
Summarise the information by selecting and reporting the main features, and make comparisons where relevant.
Write at least 150 words.
高分范文
上一题
2020/10/24 Task 2下一题
2020/10/17 Task 2