题目
范文
2020/09/26Task 1曲线图
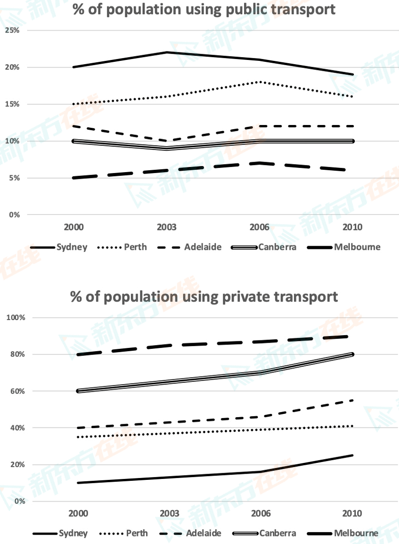
The line graphs show the percentage of people using public transport and people using private cars in five cities of Australia from 2000 to 2010.
Summarise the information by selecting and reporting the main features, and make comparisons where relevant.
Write at least 150 words.
高分范文
上一题
2020/10/10 Task 2下一题
2020/09/26 Task 2