题目
范文
2019/12/07Task 1柱状图
The chart below shows the number (thousands) of four kinds of students in the UK in 1990, 1998 and 2005.
Summarise the information by selecting and reporting the main features, and make comparisons where relevant.
Write at least 150 words.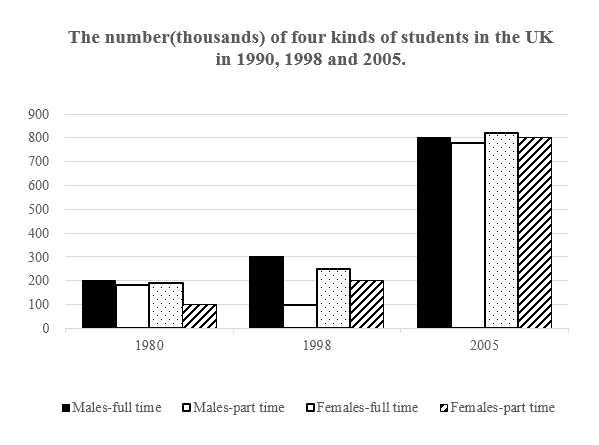
高分范文
上一题
2019/12/12 Task 2下一题
2019/12/07 Task 2