
题目
范文
2026/09/3020260930_t1_03饼状图
The charts below show the percentage of time working adults spent doing different activities in a particular country in 1958 and 2008.
Summarise the information by selecting and reporting the main features, and make comparisons where relevant.
Write at least 150 words.
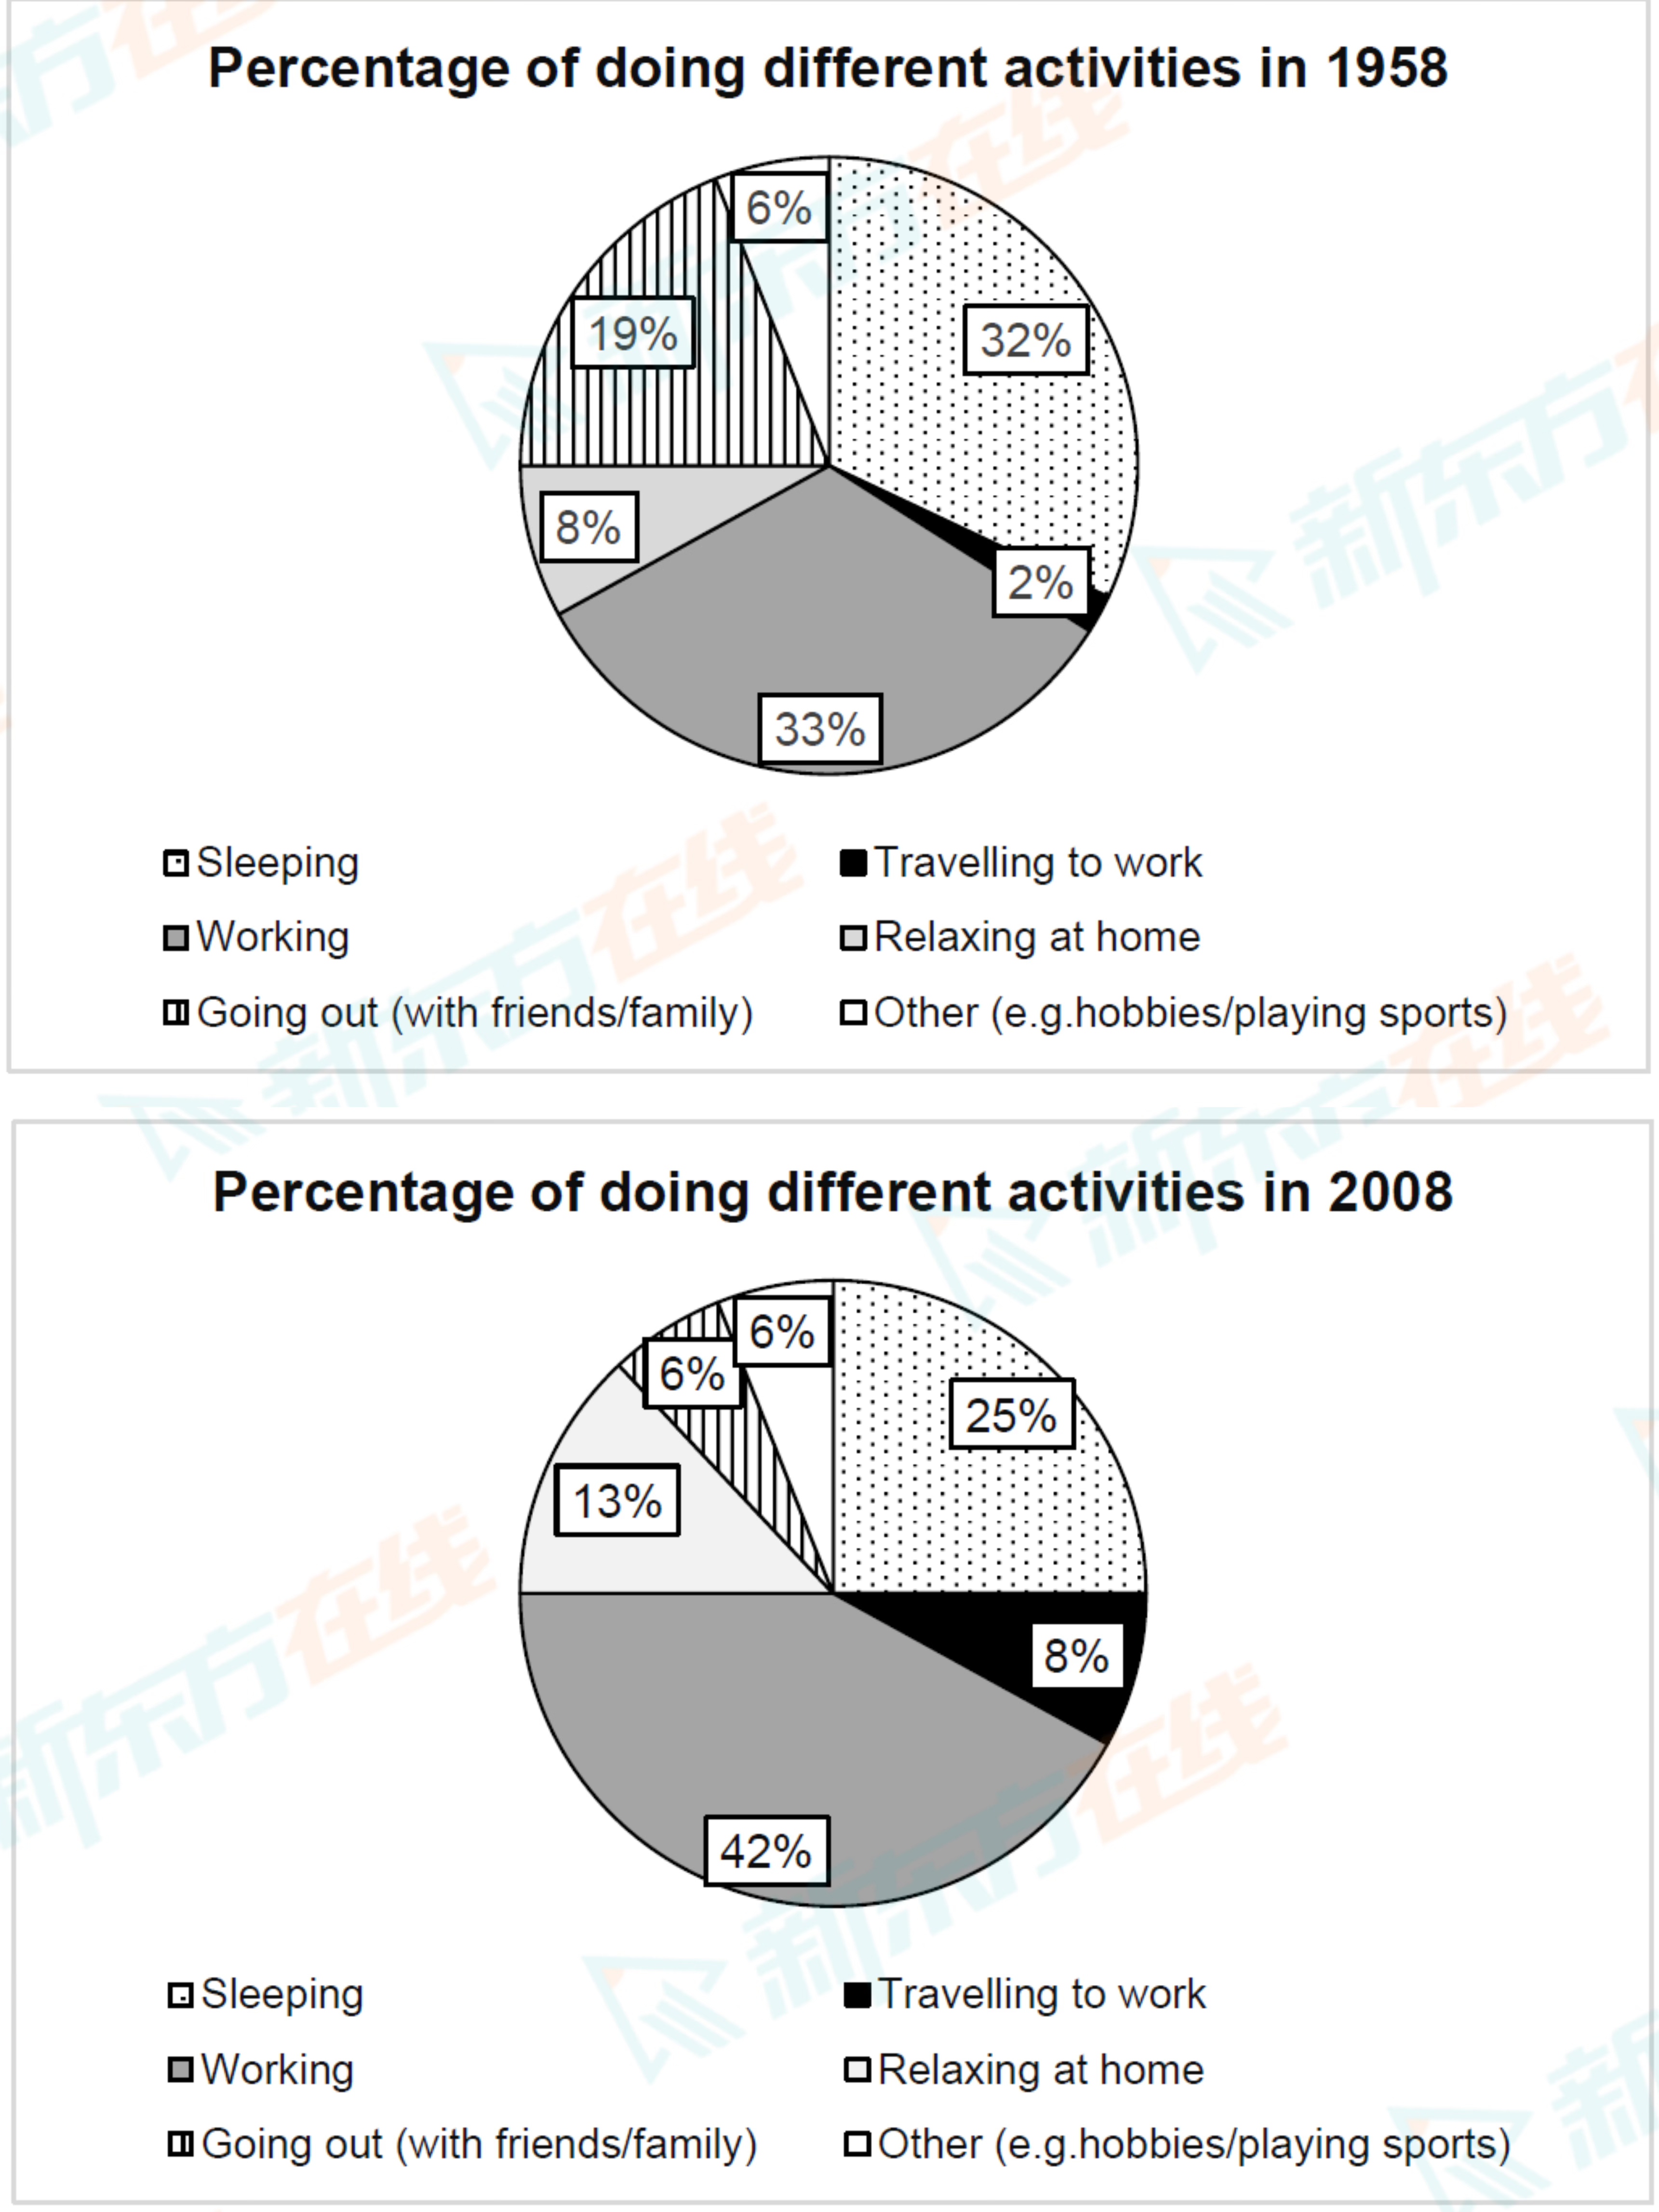
Summarise the information by selecting and reporting the main features, and make comparisons where relevant.
Write at least 150 words.
高分范文