
题目
范文
2026/08/01Task 1混合图
The charts below show the land area lost (thousand km²) per one-meter rise and the population (million) affected per one-meter rise in sea level in the predicted future.
Summarise the information by selecting and reporting the main features, and make comparisons where relevant.
Write at least 150 words.
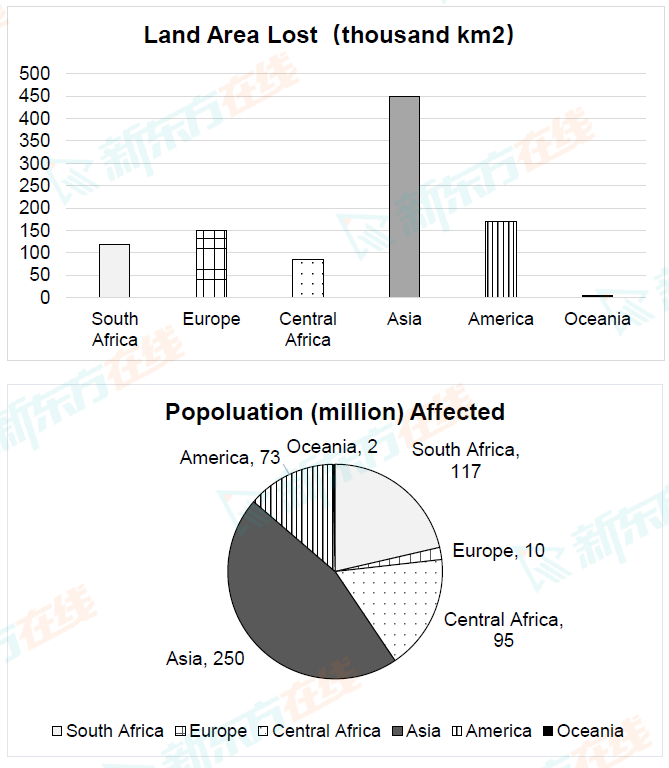
Summarise the information by selecting and reporting the main features, and make comparisons where relevant.
Write at least 150 words.
高分范文