
题目
范文
2026/05/16Task 1混合图
The table and graph below show the number of international tourists (in millions) and income from tourism in four countries in East Asia from 2000 to 2014.
Summarise the information by selecting and reporting the main features, and make comparisons where relevant.
Write at least 150 words.
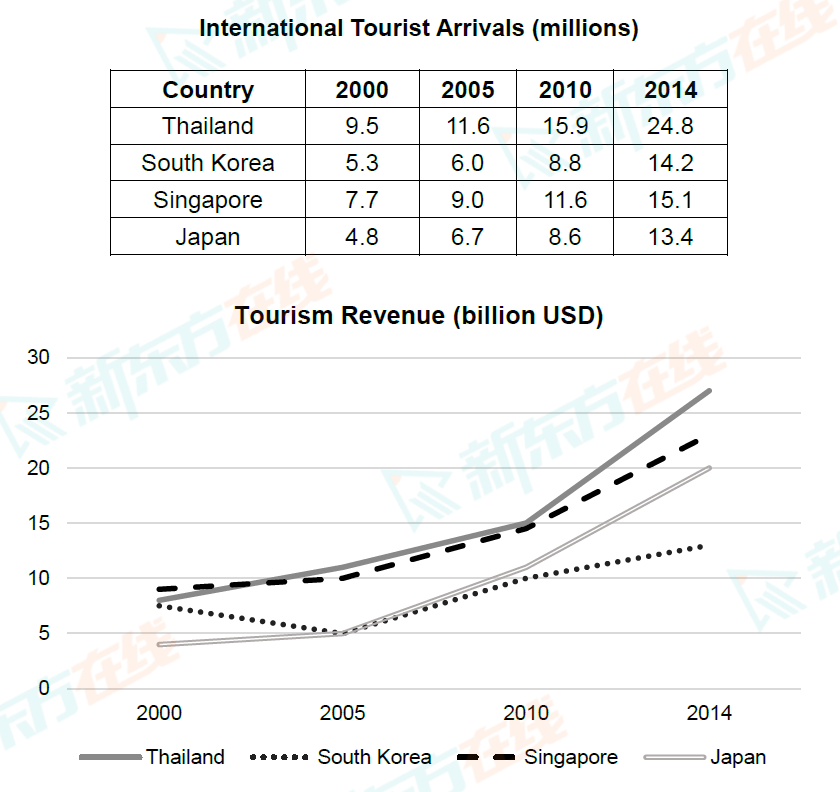
Summarise the information by selecting and reporting the main features, and make comparisons where relevant.
Write at least 150 words.
高分范文