题目
范文
2026/03/21Task 1柱状图
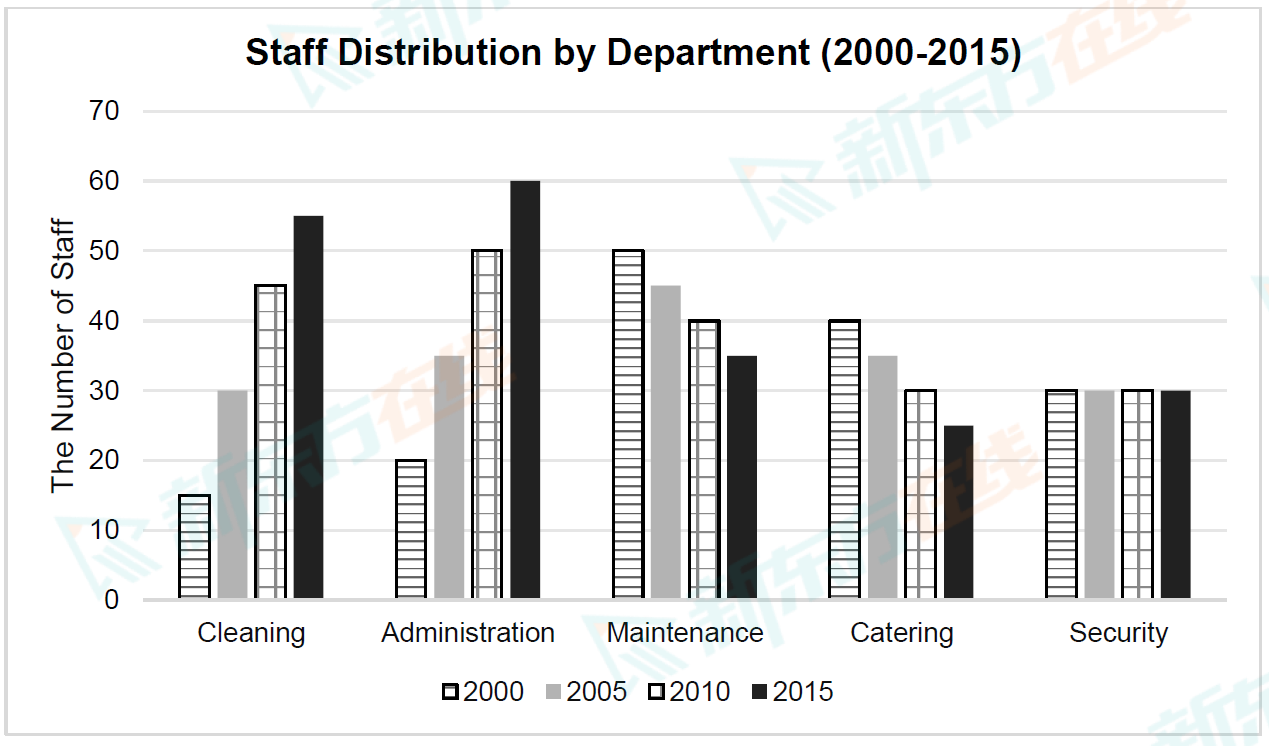
The bar chart below shows the number of five different types of non-medical staff employed at a clinic in the UK between 2000 and 2015.
Summarise the information by selecting and reporting the main features, and make comparisons where relevant.
Write at least 150 words.
Summarise the information by selecting and reporting the main features, and make comparisons where relevant.
Write at least 150 words.
高分范文