题目
范文
2025/12/13Task 1曲线图
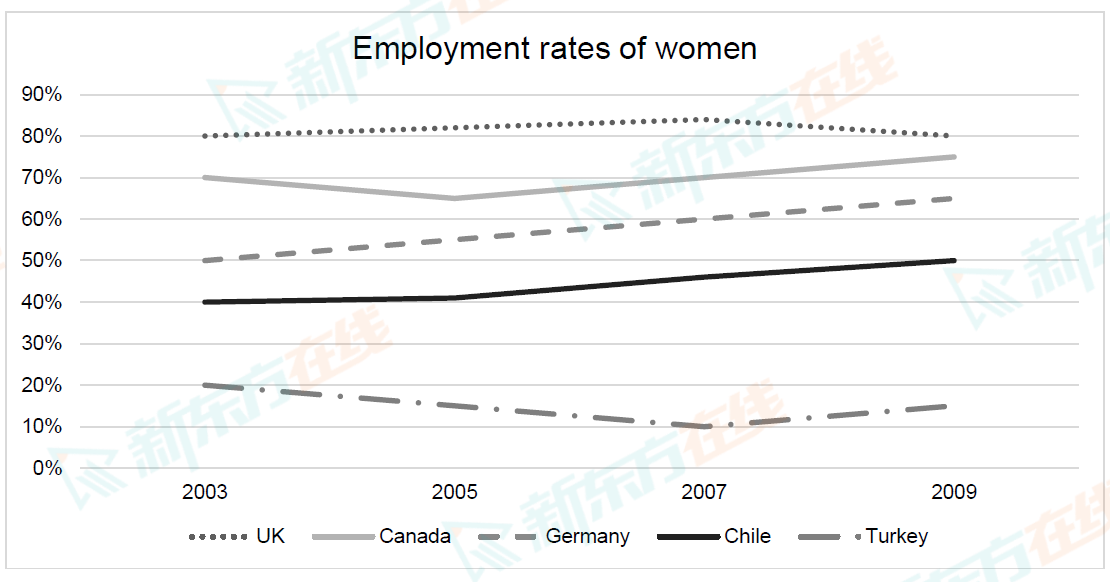
The graph below gives information about the percentage of women aged 15-64 in employment between 2003 and 2009.
Summarise the information by selecting and reporting the main features, and make comparisons where relevant.
Write at least 150 words.
Summarise the information by selecting and reporting the main features, and make comparisons where relevant.
Write at least 150 words.
高分范文