题目
范文
2025/11/01Task 1曲线图
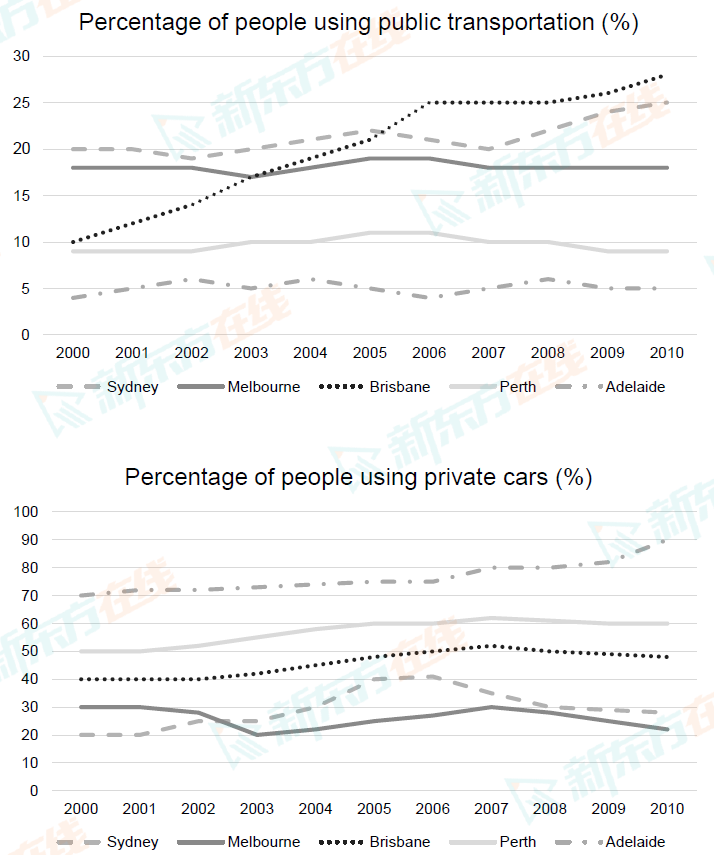
The line graphs below show the percentages of people using public and private transport between 2000 and 2010.
Summarise the information by selecting and reporting the main features, and make comparisons where relevant.
Write at least 150 words.
Summarise the information by selecting and reporting the main features, and make comparisons where relevant.
Write at least 150 words.
高分范文