题目
范文
2025/08/30Task 1曲线图
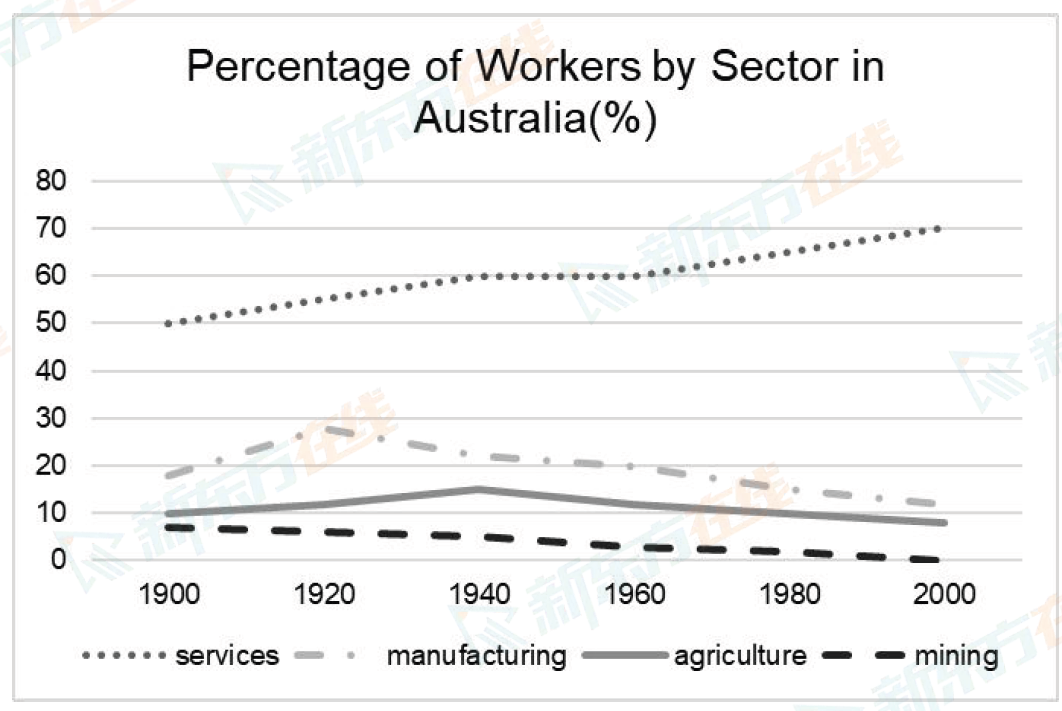
The graph below shows the proportion of workers employed by four different fields in Australia from 1900 to 2000.
Summarise the information by selecting and reporting the main features, and make comparisons where relevant.
Write at least 150 words.
Summarise the information by selecting and reporting the main features, and make comparisons where relevant.
Write at least 150 words.
高分范文