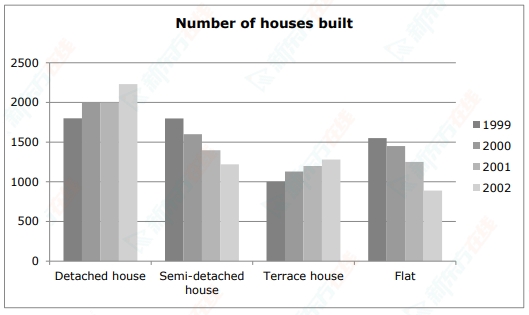
雅思柱状图小作文:1999-2002年某城市新建房屋的数量
2024.06.24 16:42
本文为大家带来的是雅思柱状图小作文:1999-2002年某城市新建房屋的数量,希望对大家的备考有所帮助。
1999-2002年某城市新建房屋的数量
The bar graph below shows the number of new houses constructed in a certain city from between 1999 and 2002. Summarise the information by selecting and reporting the main features, and make comparisons where relevant.
1999 年至 2002 年某城市新建房屋的数量

【思路解析】
本题目属于基础难度,它要求我们对比动态数据和静态数据。然而,写作中必须特别留意时态的运用,确保在描述数据的最终状态或总结时采用完成时(如现在完成时或过去完成时)。
【雅思免费试听课-0元领取】
【雅思水平测试-免费】
课程推荐

扫码添加助教号
免费获取最新雅思口语题库


