雅思混合图小作文:美国2008年贫困妇女的性别比率和年龄情况
2024.05.27 14:11
本文为大家带来的是雅思柱状图小作文:美国 2008 年贫困妇女的性别比率和年龄情况,希望对大家的备考有所帮助。
美国 2008 年贫困妇女的性别比率和年龄情况
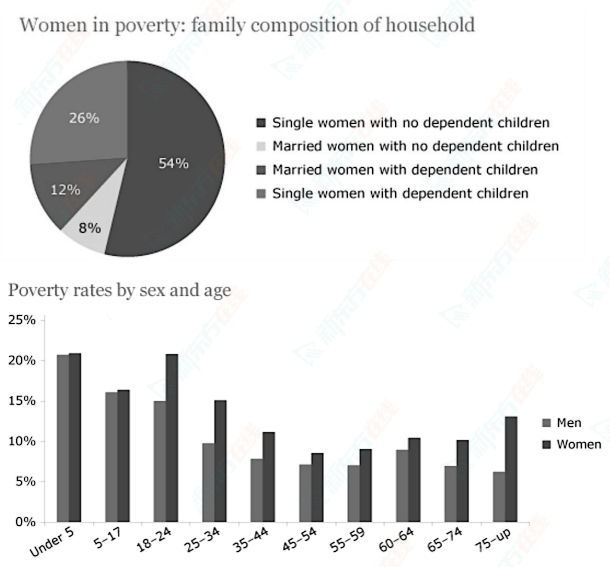
The pie chart shows the percentage of women in poverty and the bar chart shows poverty rates by sex and age. They were from the United States in 2008. Summarise the information by selecting and reporting the main features and make comparisons where relevant.
美国 2008 年贫困妇女的性别比率和年龄情况

【思路解析】这篇文章需要首先描述图表内容,包括饼图和条形图的基本信息,然后详细解释每个图表的数据。文章可以先从饼图入手,说明单身女性贫困比例最高,再转向柱状图,指出贫困率在不同年龄和性别间的差异,特别强调女性在各年龄段的贫困率普遍高于男性。
【雅思免费试听课-0元领取】
【雅思水平测试-免费】
课程推荐

扫码添加助教号
免费获取最新雅思口语题库


