2023.12.14 12:11
本文主要为大家介绍雅思柱状图小作文范文:1980年和1990年发展中国家和工业化国家的受教育程度和科学发展水平,希望对大家的雅思写作有所帮助!
小作文柱状图范文
The charts below show the levels of participation in education and science in developing and industrialised countries in 1980 and 1990.
下面的图表显示了1980年和1990年发展中国家和工业化国家的受教育程度,科学发展水平。
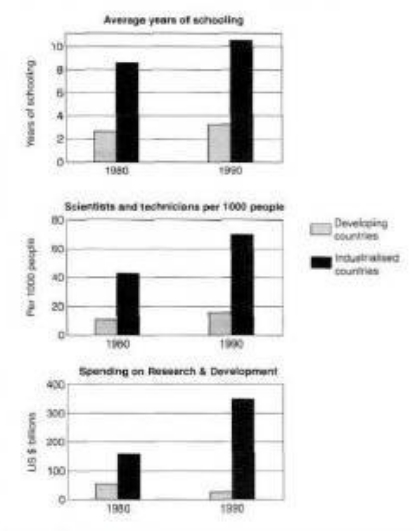
The three bar charts show average years of schooling, numbers of scientists and technicians, and research and development spending in developing and developed countries. Figures are given for 1980 and 1990.
It is clear from the charts that the figures for developed countries are much higher than those for developing nations. Also, the charts show an overall increase in participation in education and science from 1980 to 1990.
People in developing nations attended school for an average of around 3 years, with only a slight increase in years of schooling from 1980 to 1990. On the other hand, the figure for industrialised countries rose from nearly 9 years of schooling in 1980 to nearly 11 years in 1990.
From 1980 to 1990, the number of scientists and technicians in industrialised countries almost doubled to about 70 per 1000 people. Spending on research and development also saw rapid growth in these countries, reaching $350 billion in 1990. By contrast, the number of science workers in developing countries remained below 20 per 1000 people, and research spending fell from about $50 billion to only $25 billion.(184 words)


扫码添加助教号
免费获取最新雅思口语题库
