2023.12.14 11:51
本文主要为大家介绍雅思柱状图小作文范文:2002年乘客乘坐交通工具每1亿英里(PMT)的事故数量和受伤人数,希望对大家的雅思写作有所帮助!
小作文柱状图范文
The chart below shows numbers of incidents and injuries per 100 million passenger miles travelled (PMT) by transportation type in 2002.
下面的图表显示了2002年乘客乘坐交通工具每1亿英里(PMT)的事故数量和受伤人数。
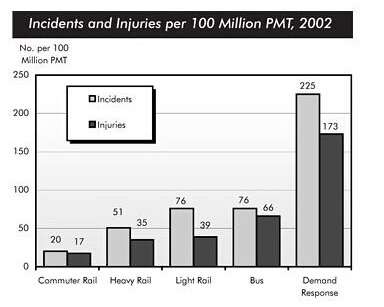
The bar chait compares the nuuber of incidents and injuries for every 100 million passenger miles travelled on five different types of public transport in 2002.
It is clear that the most incidents and injuries took place on demand-response vehicles. By contrast, commuter rail serices recorded by fat the lowest figures.
A total 225 incidents and 173 injurie - per 100 millon passenger miles travelled, took place on demand-response transport services. These figures were nearly three times as high as those for the second highest category, bus services. There were 76 incidents and 66 people were injured on buses.
Rail services experienced fewer problems. The mumber of incidents on light rail trains equalled the figure recorded for buses, but there were significantly fewer injuries, at only 39, Heavy rail services saw lower numbers of such events than light rail services, but commuter rail passengers were even less likely to experience problems. Tn fact, only 20 incidents and 17 injuries occurred on commuter trains. (165 words, band 9)


扫码添加助教号
免费获取最新雅思口语题库
