2023.12.14 10:51
本文主要为大家介绍雅思柱状图小作文范文:2000年到2006年间不同类型的电子游戏的全球销售额,希望对大家的雅思写作有所帮助!
小作文柱状图范文
The bar graph shows the global sales (in billions of dollars) of different types of digital games between 2000 and 2006.
此柱状图显示2000年到2006年间不同类型的电子游戏的全球销售额 (单位:一亿美元)
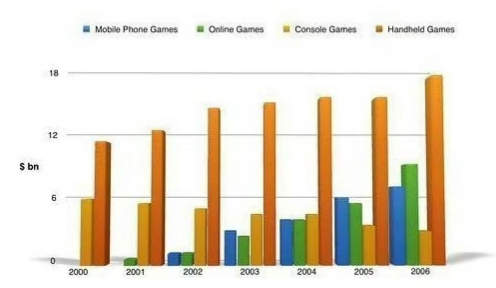
The bar chart compares the turnover in dollars from sales of video games for four different platforms,
namely mobile phones, online, consoles and handheld devices, from 2000 to 2006.
It is clear that sales of games for three out of the four platforms rose each year, leading to a significant rise in total global turnover over the 7-year period. Sales figures for handheld games were at least twice as highas those for any other platform in almost every year.
In 2000,worldwide sales of handheld games stood aaround $11 billion, while console games earned justunder $6 billion. No figures are given for mobile or online games in that vear. Over the next 3 vears, sales of handheld video games rose by about $4 billion, but the figure for consoles decreased by $2 billion. Mobile phone and online games started to become popular, with sales reaching around $3 billion in 2003.
In 2006, sales of handheld, online and mobile games reached peaks of 17.9 and 7 billion dollars
respectively. By contrast,turnover from console games dropped to its lowest point, at around $2.5 billion. (187)


扫码添加助教号
免费获取最新雅思口语题库
