2023.03.08 12:30
在雅思写作考试中,雅思小作文的图形题包含很多种图形,线图、表格图等,今天新东方在线雅思就带大家来看看雅思数据类小作文图形特点及写作重点。
雅思数据类小作文图形特点及写作重点
小作文数据类图形可以分为线图,表格,柱图和饼图,本文将选取几种常见数据类小作文考题进行一一分析。
1 )线图(动态)
C8T4
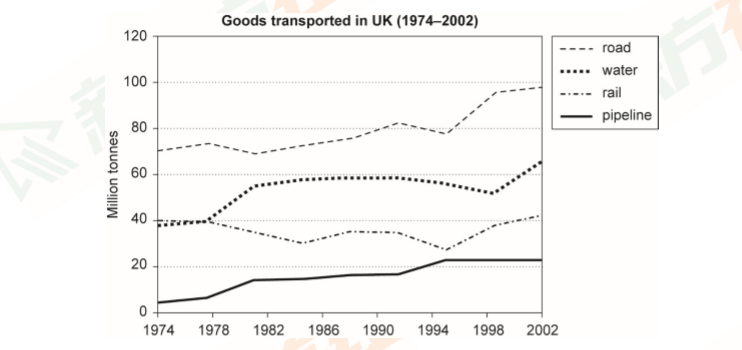
The graph below shows the quantities of goods transported in the UK between 1974 and 2002 by four different modesof transport.
线图切入点:
①高低对比( road>water and rail>pipeline)
②趋势( road上升; water and rail前四年平稳,之后water运输量尽管中间有一段平稳,但总体上升,rail运输量总体在一个数值范围内波动;pipeline 上升)
③特殊点位(起点,终点,相同点,拐点:最高或最低)
④总体描述(三升一波动)
2)表格(静态)
C7T1
The table below gives information on consumer spending on different items in five dfferent countries in 2002.
Percentage of national consumer expenditure by category -2002
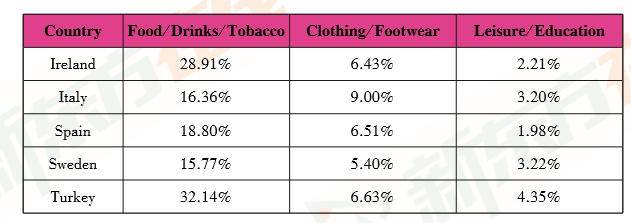
本图只出现了一个时间(2002年),数据之间只存在对比关系,没有变化。对于静态数据类图形,确定比较对象很关键。如果按照国家分类,每个国家自带三类数据,数据之间高低不同,难以比较。如若按照类别分类只比高低,就会清晰很多。
3)柱图(动态)
C9T3
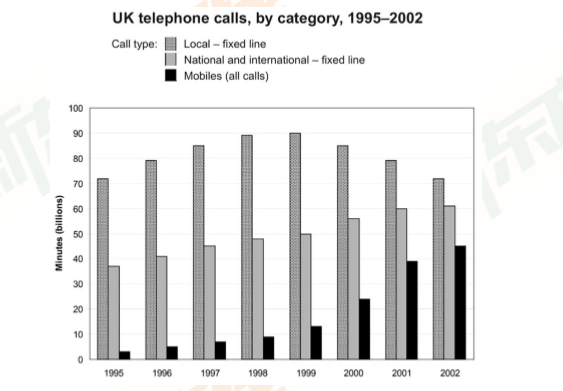
The chart below shows the total number of minutes( in billions ) of telephone calls in the UK , divided into three cate-gories , from 1995——2002.
动态柱图写法和动态线图极为相似:
①高低对比(Local-fixed line最高;National and international-fixed line居中, Mobiles最低)
②趋势(Local-fixed line 先升,后平稳,之后下降;National and international-fixed line缓慢上升; mobiles 前期缓慢上升,之后增速加快)
③总体描述(三种线路所拨打的分钟数随着时间的推移趋于接近)
4)饼图(静态)
C10T1
The first chart below shows how energy is used in an average Australian household.The second chart shows the green-house gas emissions which result from this energy use.

没有时间变化的饼图,单饼图往往出现在组合图里,与其他类型图一起构成一个完整的考题。单饼图只需按照饼面大小进行描述即可。双饼图里每个饼描述的内容不同,往往按一饼一段来布局,结尾写出两个饼图的共同与最大差异。三饼及三饼以上则要考虑饼图中的图例之间的大小关系,可能会按照类别来分段,而不是几图几段。

扫码添加助教号
免费获取最新雅思口语题库
