2021.11.19 11:48
新东方在线雅思为大家整理了2021雅思Task1小作文柱状图范文之企业垃圾,烤鸭们快来看看吧。
话题
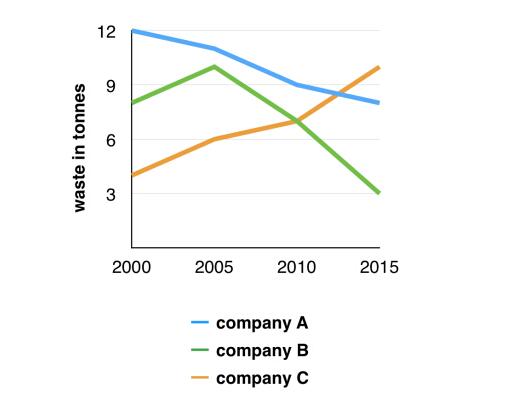
The graph below shows the amounts of waste produced by three companies over a period of 15 years.
范文
The line graph compares three companies in terms of their waste output between the years 2000 and 2015.
It is clear that there were significant changes in the amounts of waste produced by all three companies shown on the graph. While companies A and B saw waste output fall over the 15-year period, the amount of waste produced by company C increased considerably.
In 2000, company A produced 12 tonnes of waste, while companies B and C produced around 8 tonnes and 4 tonnes of waste material respectively. Over the following 5 years, the waste output of companies B and C rose by around 2 tonnes, but the figure for company A fell by approximately 1 tonne.
From 2005 to 2015, company A cut waste production by roughly 3 tonnes, and company B reduced its waste by around 7 tonnes. By contrast, company C saw an increase in waste production of approximately 4 tonnes over the same 10-year period. By 2015, company C’s waste output had risen to 10 tonnes, while the respective amounts of waste from companies A and B had dropped to 8 tonnes and only 3 tonnes.

扫码添加助教号
免费获取最新雅思口语题库
