2021.11.12 18:54
新东方在线雅思为大家整理了2021雅思Task1小作文柱状图范文之手机变迁,烤鸭们快来看看吧。
话题
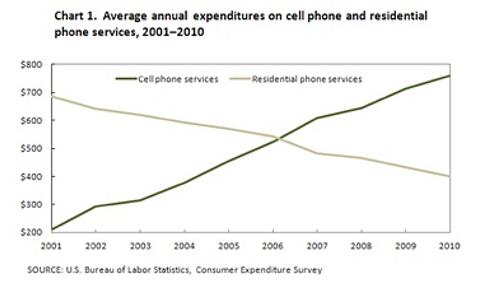
The line graph shows the average annual expenditures on cell phone and residential phone services between 2001 and 2010.
范文
The line graph compares average yearly spending by Americans on mobile and landline phone services from 2001 to 2010.
It is clear that spending on landline phones fell steadily over the 10-year period, while mobile phone expenditure rose quickly. The year 2006 marks the point at which expenditure on mobile services overtook that for residential phone services.
In 2001, US consumers spent an average of nearly $700 on residential phone services, compared to only around $200 on cell phone services. Over the following five years, average yearly spending on landlines dropped by nearly $200. By contrast, expenditure on mobiles rose by approximately $300.
In the year 2006, the average American paid out the same amount of money on both types of phone service, spending just over $500 on each. By 2010, expenditure on mobile phones had reached around $750, while the figure for spending on residential services had fallen to just over half this amount.

扫码添加助教号
免费获取最新雅思口语题库
