2019.04.26 11:23
以下是新东方在线雅思网给大家整理的2019年雅思写作备考范例解析(15),希望能够帮助大家更好的备考雅思写作考试,更多雅思写作备考内容,欢迎随时关注新东方在线雅思网。
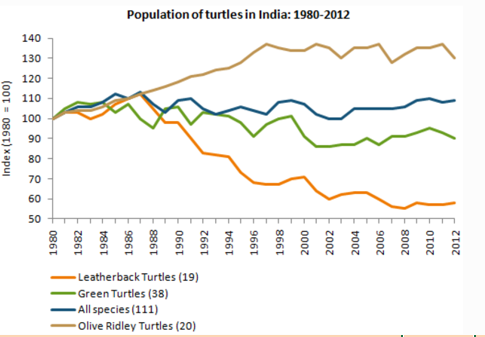
Task:The population figures of different types of turtles in India between 1980 and 2012.
思路解析:
1. 按照每条线一段进行分组;
2. 重点描述关键数据: 最大值,最小值,交点等;
3. 需要呈现明显的线段形状,如:数据不变,线段平行,剧烈的上升或下跌。
参考范文:
The line chart indicates the change of population of different types of turtles in India from 1980 to 2012.
The total number of all species of turtles in India has been relatively stable over the last two decades, although there were significant drops in numbers between 1987 and 1989 and again in 1992 and 1996. Since 2004 there has been an improvement in numbers of all species, although the graph shows a slight decrease in 2010.
In contrast, the population of Leather back turtles has suffered a severe decline, particularly in 1988 when numbers fell dramatically. The rate of decline in the population appears to have slowed and it has remained relatively stable since 2009.
There was also a fall in the number of Green turtles of around 30% between 1984 and 2002. The population increased slightly in 2010 but it had dropped again by 2012.
It is only Olive Ridley turtles that have seen a steady increase in population over this period. Their numbers dropped slightly in 2007 and again in 2012 but the overall trend has been a positive one.

扫码添加助教号
免费获取最新雅思口语题库
