2017.06.20 14:57
新东方在线雅思频道特为大家收集整理了雅思写作小作文线图考官范文:老龄人口。雅思写作考官范文很适合烤鸭研读模仿,在研读及模仿过程中,可以帮助我们检验自己的写作水平,并能很好地吸收和应用优秀范文里的优秀内容~更多雅思报名官网的最新消息,最新、最专业的雅思备考资料,新东方在线雅思网将第一时间为大家发布。
>>>更多请点击:雅思写作Task 1小作文考官满分范文
话题
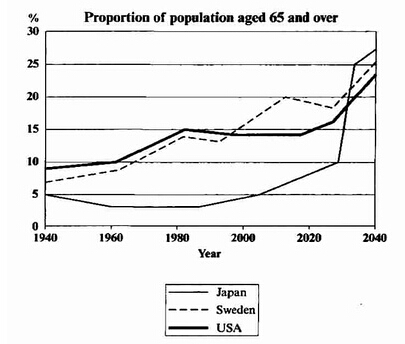
The graph below shows the proportion of the population aged 65 and over between 1940 and 2040 in three different countries.

范文
The line graph compares the percentage of people aged 65 or more in three countries over a period of 100 years.
It is clear that the proportion of elderly people increases in each country between 1940 and 2040. Japan is expected to see the most dramatic changes in its elderly population.
In 1940, around 9% of Americans were aged 65 or over, compared to about 7% of Swedish people and 5% of Japanese people. The proportions of elderly people in the USA and Sweden rose gradually over the next 50 years, reaching just under 15% in 1990. By contrast, the figures for Japan remained below 5% until the early 2000s.
Looking into the future, a sudden increase in the percentage of elderly people is predicted for Japan, with a jump of over 15% in just 10 years from 2030 to 2040. By 2040, it is thought that around 27% of the Japanese population will be 65 years old or more, while the figures for Sweden and the USA will be slightly lower, at about 25% and 23% respectively.(178 words, band 9)

扫码添加助教号
免费获取最新雅思口语题库
