2017.06.14 11:41
新东方在线雅思频道特为大家收集整理了雅思写作小作文柱状图考官范文:各地房价。雅思写作考官范文很适合烤鸭研读模仿,在研读及模仿过程中,可以帮助我们检验自己的写作水平,并能很好地吸收和应用优秀范文里的优秀内容~更多雅思报名官网的最新消息,最新、最专业的雅思备考资料,新东方在线雅思网将第一时间为大家发布。
>>>更多请点击:雅思写作Task 1小作文考官满分范文
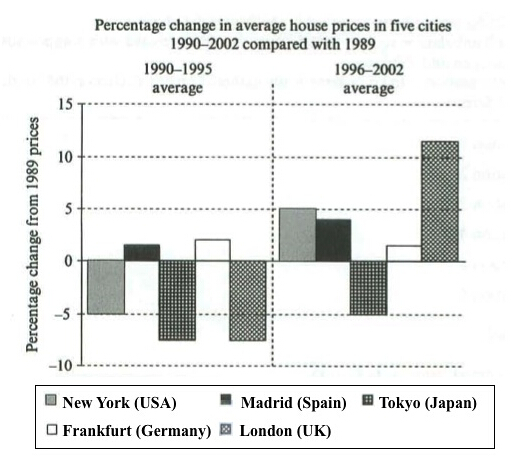
话题:The chart below shows information about changes in average house prices in five different cities between 1990 and 2002 compared with the average house prices in 1989.

满分范文:
The bar chart compares the cost of an average house in five major cities over a period of 13 years from 1989.
We can see that house prices fell overall between 1990 and 1995, but most of the cities saw rising prices between 1996 and 2002. London experienced by far the greatest changes in house prices over the 13-year period.
Over the 5 years after 1989, the cost of average homes in Tokyo and London dropped by around 7%, while New York house prices went down by 5%. By contrast, prices rose by approximately 2% in both Madrid and Frankfurt.
Between 1996 and 2002, London house prices jumped to around 12% above the 1989 average. Homebuyers in New York also had to pay significantly more, with prices rising to 5% above the 1989 average, but homes in Tokyo remained cheaper than they were in 1989. The cost of an average home in Madrid rose by a further 2%, while prices in Frankfurt remained stable.
(165 words)

扫码添加助教号
免费获取最新雅思口语题库
