2017.06.14 11:22
新东方在线雅思频道特为大家收集整理了雅思写作小作文柱状图考官范文:年龄分布。雅思写作考官范文很适合烤鸭研读模仿,在研读及模仿过程中,可以帮助我们检验自己的写作水平,并能很好地吸收和应用优秀范文里的优秀内容~更多雅思报名官网的最新消息,最新、最专业的雅思备考资料,新东方在线雅思网将第一时间为大家发布。
>>>更多请点击:雅思写作Task 1小作文考官满分范文
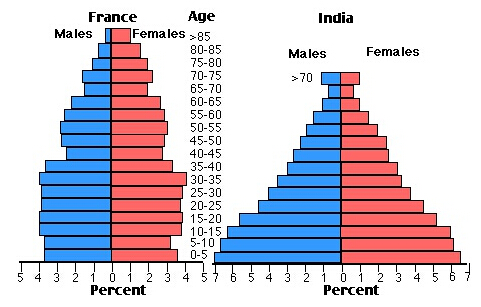
Task1:The charts below compare the age structure of the populations of France and India in 1984.

参考范文:
The two charts compare the populations of France and India in terms of age distribution by gender in the year 1984.
It is clear that the population of India was younger than that of France in 1984, with a noticeably larger proportion of people aged under 20. France, on the other hand, had a significantly larger percentage of elderly inhabitants.
In India, close to 14% of people were aged 5 or under, and each five-year age bracket above this contained an increasingly smaller proportion of the population. France’s population, by contrast, was more evenly distributed across the age ranges, with similar figures (around 7% to 8% of all people) for each five-year cohort between the ages of 0 and 40. Somewhere between 10% and 15% of all French people were aged 70 or older, but the equivalent figure for India was only 2%.
Looking more closely at gender, there was a noticeably higher proportion of French women than men in every cohort from age 50 upwards. For example, almost 3% of French 70- to 75-year-olds were women, while just under 2% were men. No significant gender differences can be seen on the Indian population chart.

扫码添加助教号
免费获取最新雅思口语题库
