2015.08.07 10:49
新东方在线雅思频道特为大家收集整理了雅思写作Task1柱状图考官范文(55)。认真研读一定的雅思范文及作文模板可以帮助我们检验自己的写作水平,并能很好地吸收和应用优秀范文里的优秀内容~更多雅思报名官网的最新消息,最新、最专业的雅思备考资料,新东方在线雅思网将第一时间为大家发布。
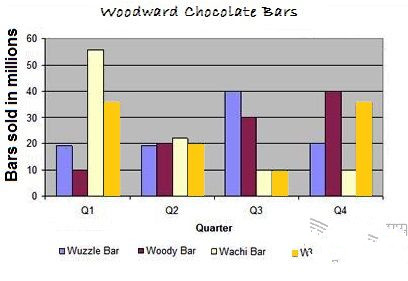
The graph below shows the quarterly sales figures of Woodward chocolate bars for 2010.
Summarize the information by selecting and reporting the main features, and make comparisons where relevant.

Sample Answer:
The provided bar graph shows sales data of Woodland chocolate for the year 2010. As is observed from the given data, Wachi Bar was the most sold chocolate bar in the first quarter of the year while the popularity of Woody bar increased over the time for the given year.
According to the given bar graph, from January to March around 19 million Wuzzle chocolate bars were sold in Woodland. During this period Wachi chocolate bar was the most sold chocolate which was sold more than 55 million bars. Wozic was the second most sold chocolate bar during this first quarter with more than 45 million sales volumes. The woody bar was the least sold item for this quarter with only 10 million sales. In the second quarter the sales volume for all these four chocolate bars were around 20 million. Interestingly in third quarter both Wachi and Wozic chocolate sales volume decreased to 10 million while the Wuzzle and Woody bars’ sales increased to 40 and 30 million respectively. In the final quarter, the sales volume for Wachi chocolate bar remained unchanged as it was in the third quarter while the Woody bars’ sales volume increased by 10 million compared to the previous month. In this final quarter, the Woody bar was the highest sold chocolate type and the sales volume of this bar increased throughout the year. Wachi bar and Wozic bar were sold around 20 and 35 million in the final quarter.
In summary, there was common pattern of the sales volumes of the four chocolate types for the year 2010 except that the sales amount of Woody bar increased in each quarter while this volume decreased for the Wachi bar.

扫码添加助教号
免费获取最新雅思口语题库
