2015.07.31 11:12
新东方在线雅思频道特为大家收集整理了雅思写作Task1柱状图考官范文(27)。认真研读一定的雅思范文及作文模板可以帮助我们检验自己的写作水平,并能很好地吸收和应用优秀范文里的优秀内容~更多雅思报名官网的最新消息,最新、最专业的雅思备考资料,新东方在线雅思网将第一时间为大家发布。
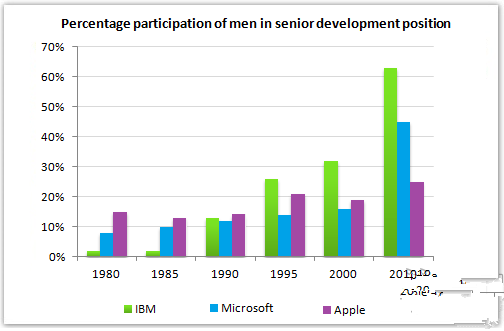
The bar chart below shows the percentage participation of men in senior development in three companies between 1980 and the year 2010.
Summarise the information by selecting and report in the main features, and make comparisons where relevant.

Sample Answer:
The provided bar graph compares the number of male senior developers in three major software companies namely IBM, Microsoft and Apple between 1980 and 2010. As is presented in the graph, Initially Apple had the largest percentage of senior development employees but after 30 years IBM employed the largest percentage of such employees.
As is presented in the bar graph, initially in 1980, IBM had less than 3% senior male developers while Microsoft had 8% and Apple had about 15% such senior developers. After 10 years in 1990, the percentage become almost same for these three companies. In 1995, the percentage of senior male employees in IBM got largest among the given three company and this kept on increasing till 2010. Finally in 2010, IBM had the largest percentage of such employees making more than 60% while Microsoft had 45% and Apple had about 25% of such senior developers.
In summary, the number of male senior developers increased in all the three companies but the rate of increase in IBM and Microsoft were much more higher than the Apple.
(Approximately 179 words)

扫码添加助教号
免费获取最新雅思口语题库
