2015.07.27 11:55
新东方在线雅思频道特为大家收集整理了雅思写作Task1饼状图考官范文(9)。认真研读一定的雅思范文及作文模板可以帮助我们检验自己的写作水平,并能很好地吸收和应用优秀范文里的优秀内容~更多雅思报名官网的最新消息,最新、最专业的雅思备考资料,新东方在线雅思网将第一时间为大家发布。
The two graphs show the main sources of energy in the USA in the 1980s and the 1990s.
Write a report for a university lecturer describing the changes which occurred.

Sample Answer:
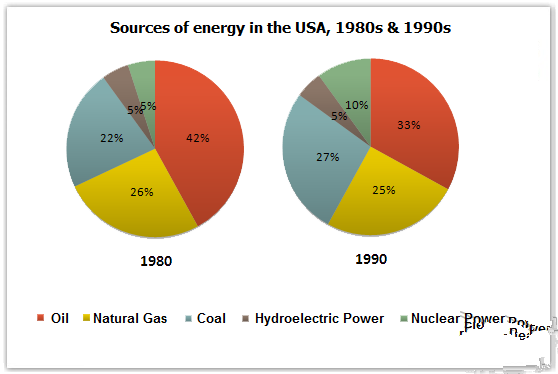
The given pie charts shows data on the main energy sources in the United States of America for two decades. As is presented in the pie charts, oil was the main energy source for the USA both on 80s and 90s.
According to the given data, oil was the main energy source in the USA which was 42% in 1980. The second largest energy source in this decade was the natural gas which supplied 26% of total energy in the same period. Then coal supplied more than 20 percent energy demand in USA while hydroelectric power and Nuclear power both supplied 5% of the total energy.
In the next decade, the Nuclear power produced one tenth of total energy demand and that was almost double that it was in the previous decade. The hydroelectric power as an energy source remained unchanged as it provided 5% of total energy demand in this decade also. The two other main sources for energy in the USA remained almost unchanged in this decade and those two sources were Coal and Natural Gas. Finally the use of oil as an energy sources reduced to 33%, which is almost 10% less than the previous decade, but remained the largest source albeit the reduction in this 90s decade.
In summary, the use of oil and coal had reduced and their places as energy sources were replaced by the use of Nuclear power in the USA.

扫码添加助教号
免费获取最新雅思口语题库
