2015.07.27 11:51
新东方在线雅思频道特为大家收集整理了雅思写作Task1曲线图考官范文(9)。认真研读一定的雅思范文及作文模板可以帮助我们检验自己的写作水平,并能很好地吸收和应用优秀范文里的优秀内容~更多雅思报名官网的最新消息,最新、最专业的雅思备考资料,新东方在线雅思网将第一时间为大家发布。
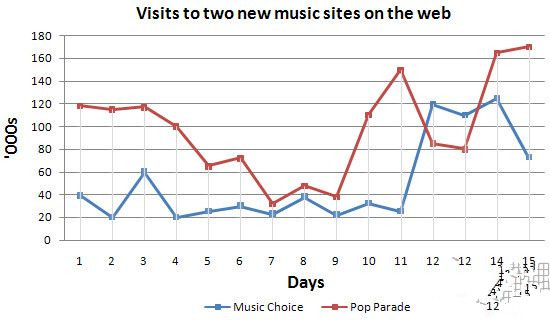
The graph below compares the number of visits to two new music sites on the web.
Write a report for a university lecturer describing the information shown below.

Sample Answer:
The given line graph compares the number of visitors in two new music related websites for 15 days duration. As is observed from the graph, Pop Parade music sites got more visitors than the other website except for the 12th to 13th day. On an average the Pop Parade got more hits from visitors than Music choice website.
Initially Pop Parade got 120 thousands visitors on day 1 while the Music choice got around 40 thousand visitors on the same day. For the first 1 week, the number of hits on Pop Parade site declined and reached to less than 40 thousand in day 7. On the other hand, Music choice’s visitor count fluctuated and reached to 20 thousand on day seven. After day 9, Pop Parade’s visitors increased dramatically and reached to over 140 thousands on day 11. While the hits on Music Choice website increased to 120 thousand on day 12. On the last three days, both of the websites got a good number of visitors. Finally on day 15th, the Music choice website’s visitors’ number reached to around 80 thousand while that number reached to over 165 thousand for the other website.
In conclusion, the Pop Parade had been more successful than the Music choice in terms of visitor count and both sites showed fluctuation on their visitor count.
(Approximately 224 words)

扫码添加助教号
免费获取最新雅思口语题库
