2015.07.24 15:35
新东方在线雅思频道特为大家收集整理了雅思写作Task1曲线图考官范文(3)。认真研读一定的雅思范文及作文模板可以帮助我们检验自己的写作水平,并能很好地吸收和应用优秀范文里的优秀内容~更多雅思报名官网的最新消息,最新、最专业的雅思备考资料,新东方在线雅思网将第一时间为大家发布。
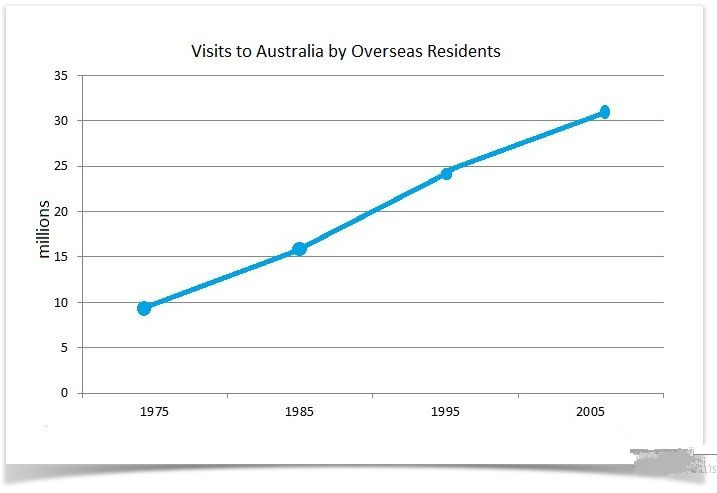
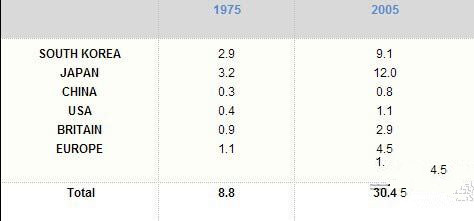
The line graph below shows the number of annual visits to Australia by overseas residents. The table below gives information on the country of origin where the visitors came from.
Write a report for a university lecturer describing the information given.


Sample Answer:
The given line graph and table give data on the number of overseas visitors traveling to Australia in millions of people from the year 1975 to 2005 and shows the number of travellers from 6 different parts of the world.
As is presented in the illustration, the number of visitors traveling to Australia raised steadily and the majority of these visitors came from Japan, South Korea and Europe. Almost 10 million people visited Australia in the year 1975 and this amount increased to over 15 million after 10 years. In the year 1995, the total visitor traveled Australia was approximately 24 million and finally in 2005 well over 30 million.
The second table gives data on the number of visitors from 6 different regions who came to visit Australia in 2 different years with a 30 years interval. Both in 1975 and in 2005, Australia had the largest number of Japanese tourists followed by South Korea. In 2005, tourists from these 2 countries who came to visit Australia were about 20 million while 4.5 million tourists came from Europe and only 1.1 million from USA. The least number of tourists came to Australia during this period are from China which was only 0.3 million in 1975 and 0.8 million in 2005. The statistics of the table shows that the total tourist visited Australia from 6 different parts of the world increased significantly in 300 years amounting well over 30 million in 12005 compared to the total number of 8.8 million 30 years earlier.
(Approximately 250 words)
Alternative Answer:
The provided graphs and table shows data on the number of overseas travelers visited Australia from the year 1975 till 2005 and their origin where they came from. As is observed in the line graph, in 1975 8.8 million of foreign travelers visited Australia and this number increased steadily each year. In 2005, this visitor’s number reached to 30.4 million which is almost double than the visitors’ number in 1985.
The highest number of tourists came from Japan. In 1975, more than 3 million tourists came from Japan which is more than the total tourists came from Europe, Britain, China and USA. This number reached to 12 million in 2005 which contributed one third of the total tourist of this year. Second largest tourist came to Australia from South Korea both in 1975 and in 2005. From Chinese tourist are the lowest in number among the 6 regions.
In short, the number of total tourist who came to visit Australia increased steadily and the highest number of tourist came from Asia, specifically from Japan and South Korea.
(Approximately 177 words)

扫码添加助教号
免费获取最新雅思口语题库
